Engineering · 2021
COVID vaccination dashboard
Personal project
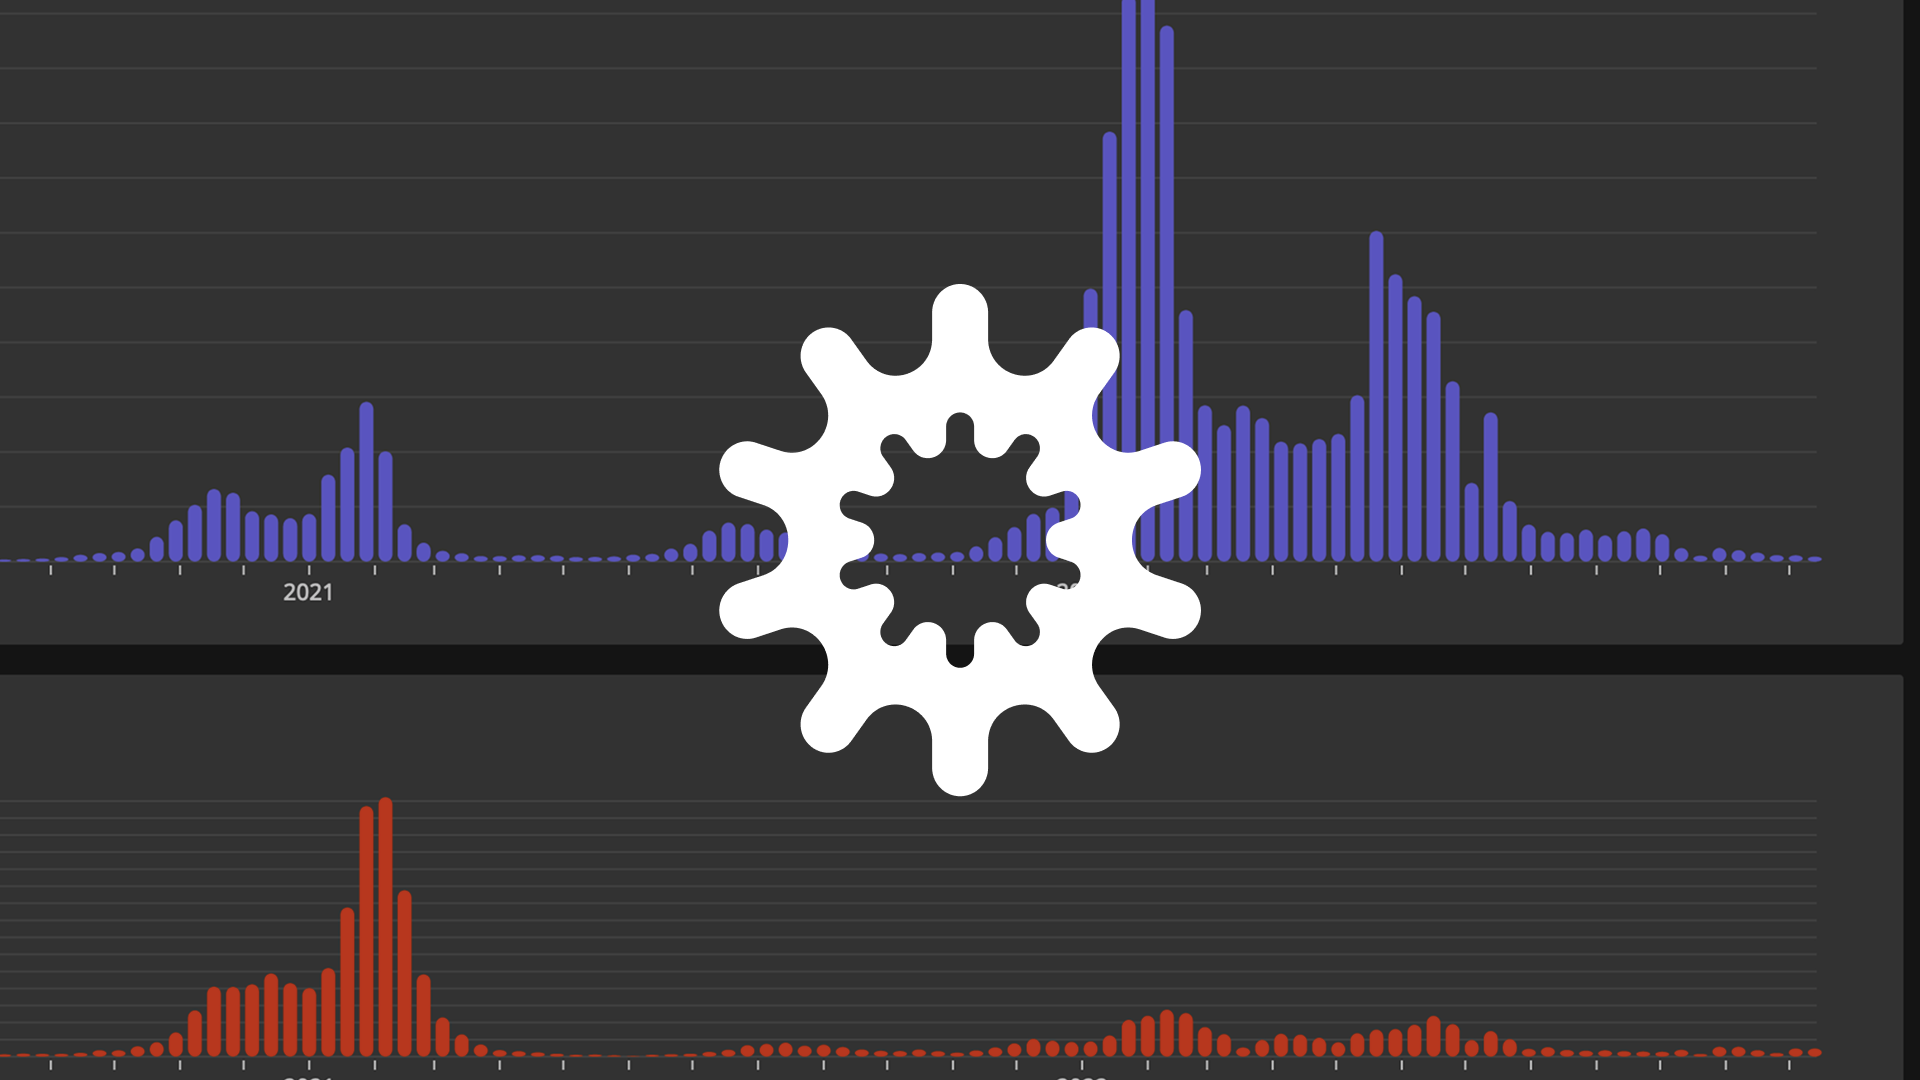
Country comparison charts with React + D3 and public data.
Story
A small dashboard on Our World in Data to compare vaccination progress across countries — still a clean proof of data-viz craft.